Each fall, educators from the greater Pittsburgh area convene at The Warhol for its Teacher Open House. Think of the three-hour event as an all-access pass to the museum: teachers can preview special exhibitions, listen to lectures from curators and artist-educators, engage in art-making activities, and learn about how they can incorporate The Warhol into their curricula. And to top it all off, teachers may receive Act 48 professional development credit hours!
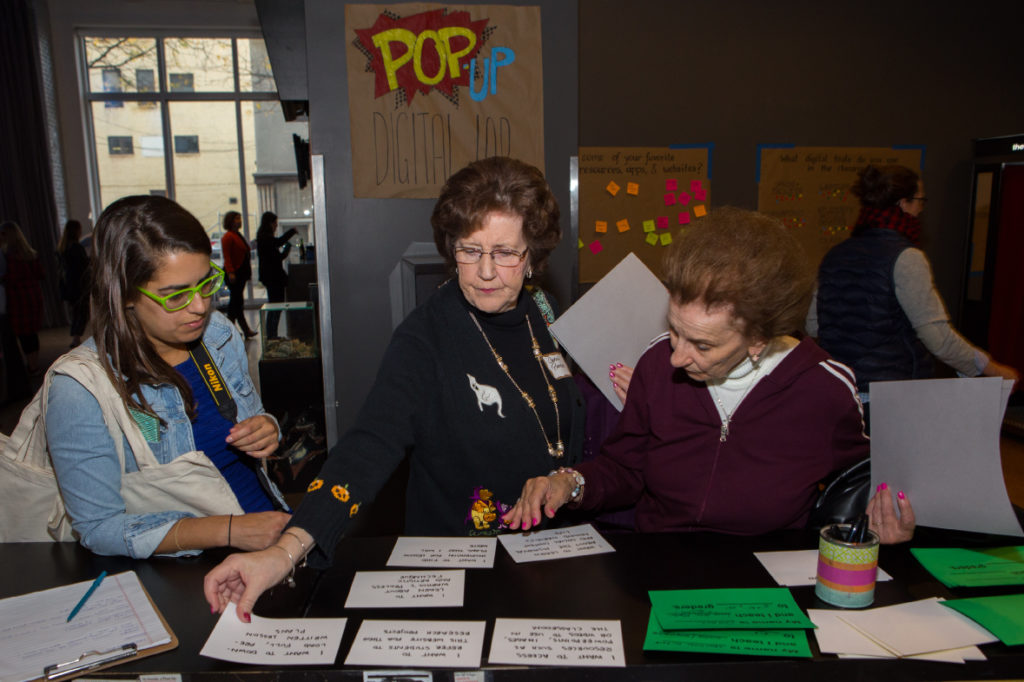
The digital engagement team has been thinking about how its technology resources can better serve the needs of teachers. At this year’s Teacher Open House on October 25, we transformed a small corner of our entrance space into a Pop-Up Digital Lab—a space in which teachers were invited to share how they use technology, test out our digital resources, and provide feedback on how to improve our offerings to fit their needs.
In designing our Pop-Up Digital Lab, we were inspired by the Indianapolis Museum of Art’s Test It Lab, in which the museum takes over a museum space for a number of weeks. Visitors passing by the space give quick feedback on a number of future museum experiences, whether it’s voting on which language they prefer on a wall panel or testing a paper prototype for a mobile app. The findings from the Test It Lab inform what ends up in exhibition galleries later down the line.
The Pop-Up Digital Lab was a fun and fast way to collect data as we embark on new digital projects and consider revamping old ones. We are in the beginning stages of redesigning warhol.org to better serve the needs of our various audiences, and a core group we hope to target is teachers looking for Andy Warhol-related resources for their lesson plans or planning to visit the museum with their class.
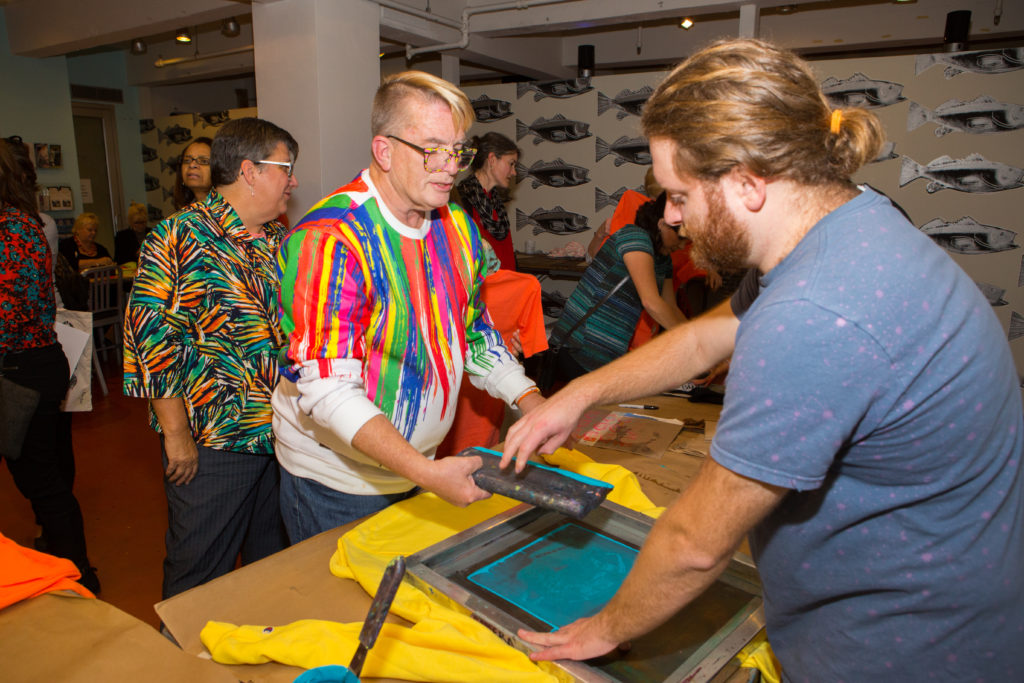
Additionally, the Teacher Open House was a great opportunity to test the value of D.I.Y. POP, an iOS app that allows users to learn about and use Warhol’s silkscreening process. We launched the app on 2011; five years after its premiere, we hoped to gauge teachers’ interest in incorporating D.I.Y. POP into their curricula in order to assess whether we should revamp the app.
During the course of this year’s Teacher Open House, we asked educators to drop by the Pop-Up Digital Lab and participate in a number of activities related to our research questions: What are teachers looking for in online resources from an art museum like The Warhol? How do they currently use digital tools in their teaching practices? How might we improve our existing digital resources to better serve teachers’ needs?
Inspiration Wall
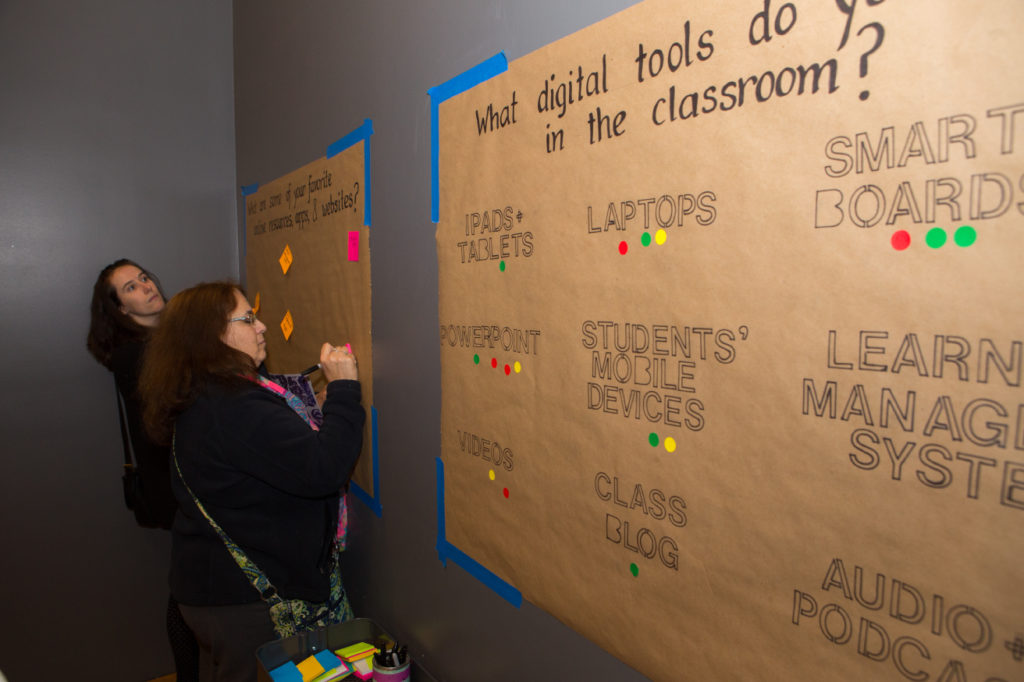
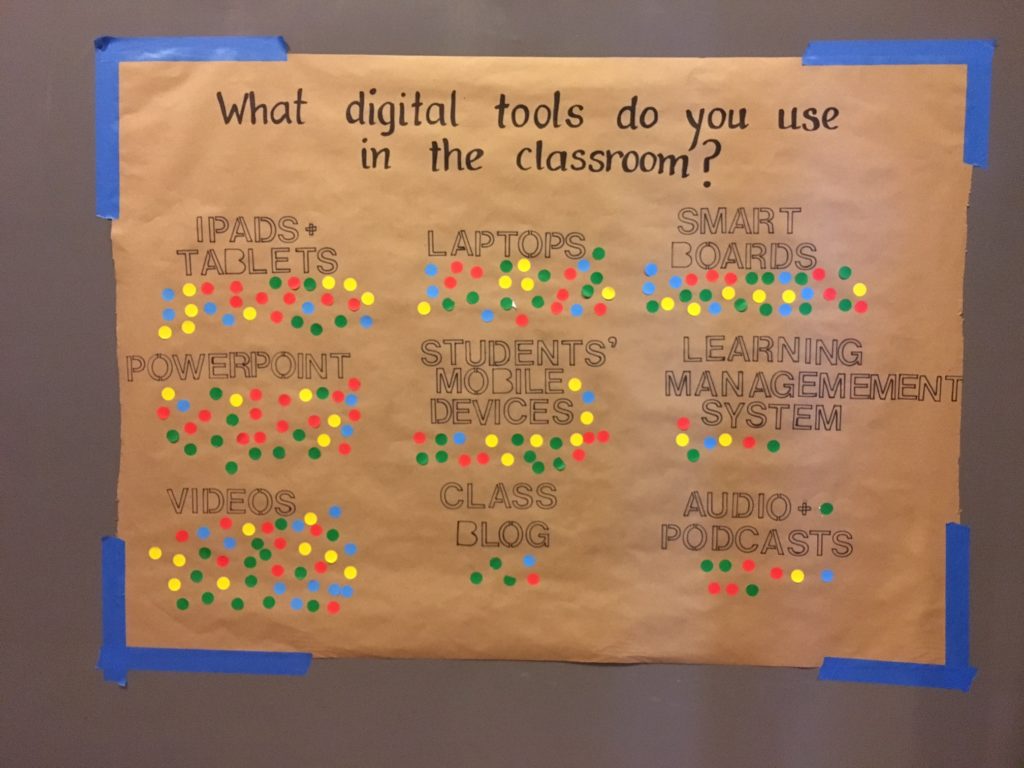
At this unfacilitated station, teachers were invited to stop by the Inspiration Wall and let us know about how they use technology. On one giant sheet of butcher paper, we posed the question “What are some of your favorite online resources, apps, and websites?” Teachers wrote responses on sticky-notes and attached them to the butcher paper. Next to the sticky-note poll, we had teachers use dot stickers to “vote” on the digital tools they use in their classrooms. We populated this second sheet of butcher paper with a number of potential responses: audio and podcasts, class blog, videos, learning management systems, students’ mobile devices, powerpoints, smart boards, laptops, and iPads/tablets.
Explore D.I.Y. Pop
At the following station, teachers were invited to go through the process of creating a silkscreen print on our D.I.Y. POP app. The app allows users to use Facilitators observed the experience of first-time users, capturing their frustrations about the interface design and asking how teachers could see themselves using this with their students.
Dive into Resources & Lessons
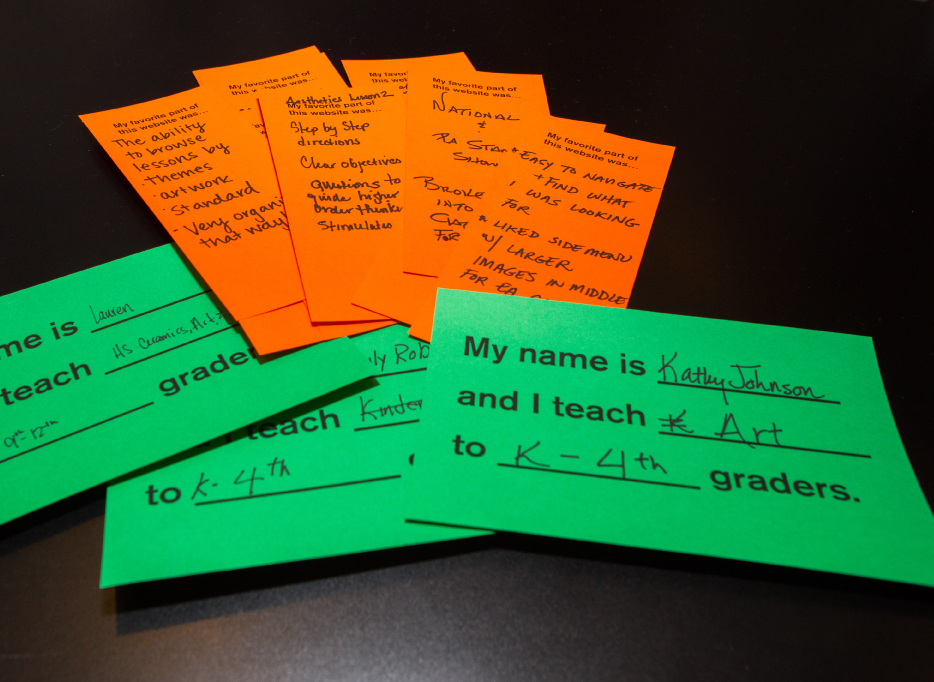
We also set up an unfacilitated station that allowed educators to navigate our existing education resources on warhol.org. Teachers navigated our lesson plans and filled out comment cards about their experience using the site.
Each comment card each had one of three prompts on them:
- My favorite part of this website was…
- One thing I found frustrating about this website was…
- I would have loved to have seen…
We hoped that these questions would help us get a broad sense of how people were feeling about the resources and lessons section of the site, and they did ultimately yield a lot of valuable information.
Card Sorting Activity
At our final station, teachers were invited to participate in a facilitated card-sorting activity that would inform us as we rethink the resources and lessons section of our website. Participants were given a set of eight cards, each of which had a statement about what they might be looking for on The Warhol’s online resources. The statements provided were:
- I want to find inspiration for lesson plans I will write.
- I want ideas for art-making activities.
- I want access to resources such as powerpoints, images, or videos to use in the classroom.
- I want to download full, pre-written lesson plans.
- I want to learn about the historical and social context around Warhol’s life.
- I want to learn about Warhol’s process and artistic technique.
- I want to learn about specific artworks.
- I want to refer students to this website for their research projects.
First, we asked teachers to eliminate statements that didn’t reflect why they might go to The Warhol’s education page. Afterward, teachers ranked the remaining statements by importance. We took a photograph of their top priorities—along with the grades and subjects they teach—as a quick snapshot of each data set.
Findings
After collecting all this data, we needed to crunch the numbers to make meaning from it!
The card-sorting exercise in particular yielded a lot of useful data; we had 20 participants who each gave us information about eight distinct statements. To organize this information in a meaningful way, we ultimately decided to award points to each statement based on how it was ranked. Cards that were ranked as most important received eight points, second most important received seven points, and so on. Cards that were eliminated entirely received zero points.
We then calculated the average score each statement was awarded overall and by the grades that the teachers taught. For this analysis, we considered high-school teachers to be teachers whose students were predominantly in grades 9 to 12, middle school teachers to be teachers whose students were predominantly in grades 5 to 11, and elementary school teachers to be teachers whose students were predominantly grades 4 and below.
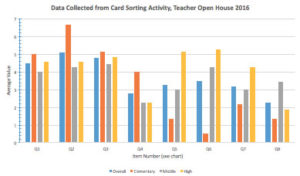
This chart displays the average score each of the eight statements (listed in order above) received in each category. We were most interested to see what cards the teachers ranked highest and lowest. This data is summarized below:
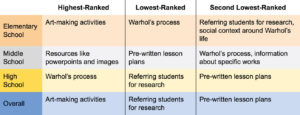
In some ways, this data fit our expectations. It made sense to us that elementary school teachers would be more interested in art-making activities than exploring more of the scholarly analyses about Warhol’s life and works, for example. However, some of the results were also surprising. High school teachers, we assumed, would be interested in recommending warhol.org to their students as a resource for research, but it turned out to be their lowest-ranked statement.
Our analysis of the dot sticker vote from the Inspiration Wall was much more straightforward; we simply had to tally the votes. We received 202 responses.
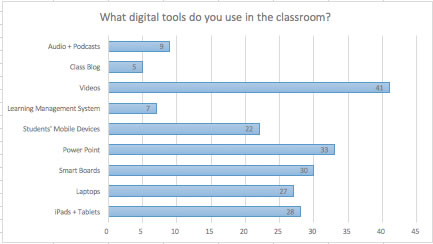
This was the first time we’ve collected data on whether teachers take advantage of their students’ personal devices, so it was interesting to learn the prevalence of allowing students to use their mobile phones. It was also surprising to see that a relatively high number of teachers use interactive whiteboards called Smart Boards, which was a technology we hadn’t anticipated being so popular.
In the other Inspiration Wall activity, we received a 97 responses about educators’ favorite digital resources, and most of these were unique. However, we did find some trends among the responses. For example, Pinterest was cited as a resource 11 times. There were also seven different mobile applications mentioned, as well as a number of websites. Five museum websites were mentioned, in addition to four references to YouTube in general or specific YouTube channels. The learning management system Schoology and crowdsourcing community Teacherspayteachers were also each referenced multiple times. This open-ended activity has provided us with many sources to use for inspiration in the future, as well as ideas for our own digital resources. For example, we’re considering making it easy for teachers to “pin” activities and lesson plans from our website to their own Pinterest boards, and we see that teachers really crave short videos to share with their students.
While the “Explore D.I.Y. Pop” station did not provide quantitative data, it did give us insight into the value the app might provide to educators. We heard that teachers liked the way the app explained Warhol’s process and thought it was a valuable teaching tool, but that several of the bugs in the app (for example, videos that no longer work) take away from the experience. Some teachers expressed an interest in using D.I.Y. Pop to allow their students to get familiar with the screen printing process before doing their own prints in the classroom, and others mentioned that in the case that they were unable to provide an in-classroom screen printing activity for their students, using the app might still allow students to experience and learn about screen printing.
We also learned a lot from the comment cards that teachers filled out while exploring our education website at the “Dive into Resources & Lessons” station. We received 28 responses total, 21 of which discussed the participant’s favorite part of the website, four of which discussed what frustrated the participants, and three of which discussed what else participants would have liked to have seen on the website.
While it is difficult to quantify subjective responses, some strong trends did emerge. Four of the 28 comment cards mentioned that the website was extremely slow to load, and three of the cards noted the website clearly displayed the national and Pennsylvania teaching standards. “I LOVE that Sixteen cards gave positive feedback on different aspects of the lesson plans, such as the high quality of certain sections of the lesson plans. However, as far as the user interface goes, the teachers were divided; two teachers commented that they liked the interface, while others commented that they wished it was more intuitive. This was a good place to start gathering thoughts on the website, but because the station was unfacilitated, we tended to get praise rather than critical feedback, and we couldn’t dig deep into the motivations behind the feedback. We will have to continue gathering data to clarify these responses.
Moving Forward
We learned a lot from the Pop-up Digital Lab that will help inform digital projects in the future, but perhaps the most important learnings were about what user research means at a museum.
- User testing and evaluation doesn’t always have to be formal. The Digital Lab was a scrappy endeavor from the beginning; we hand wrote and painted all of the signage and used simple analog tools such as voting dots and post-it notes. It would have been great to have a really sleek, polished look for the lab, but the teachers appreciated the D.I.Y. nature of the event.
- It’s good to have a mix of facilitated and unfacilitated activities. The facilitated stations, especially the card-sorting activity, yielded the most robust qualitative data. However, having unfacilitated activities such as the Inspiration Wall and the education website response cards were still valuable and allowed us to gather more data with fewer Warhol staff resources.
- Our museum activities are opportunities to learn about users. This year, the digital engagement team has been thinking about how we can infuse user research and evaluation at all stages of a project development. After the Teacher Open House, we’d like to take that mantra one step further: user research should be woven into all of our museum activities, whether it’s the everyday museum visit or a special event.
The Pop-up Digital Lab served as a great model for quickly collecting user data with a limited budget and staff resources. We’re looking forward to taking our findings from the Pop-up Digital Lab to build better technology experiences for teachers and all learners in the future!